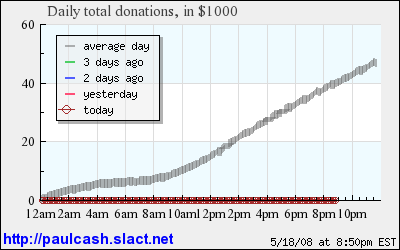
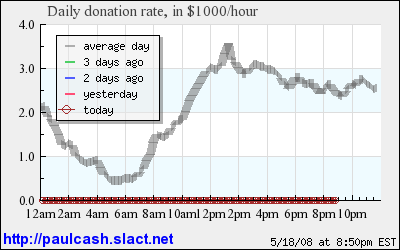
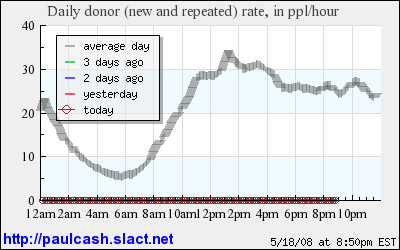
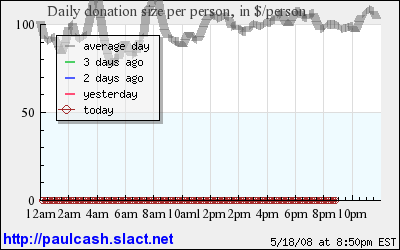
I've reworked the averaging algorithm today -- it's more accurate overall, but it's more jittery. I'll fix this when I have time, as right now I'm a bit swamped with finals.
With that said, here's to 10 million!
Showing posts with label site updates. Show all posts
Showing posts with label site updates. Show all posts
Saturday, December 15, 2007
Status update

Friday, November 30, 2007
Linkable graphs
Hooray for small messageboard-friendly graphs!
Donations Collected
http://paulcash.slact.net/today-paulcash-small.png
Donation Rate
http://paulcash.slact.net/today-paulflow-small.png
Donor Rate
http://paulcash.slact.net/today-paulpeople-small.png
Donation Size
http://paulcash.slact.net/today-paulsize-small.png
Link to these all you want -- I have plenty of bandwidth to spare. These are tested and pretty much guaranteed to work and keep updating even through moneybombs.


Updates and Minibombs
I apologize for not keeping this blog up to date. This will be remedied. Meanwhile, I'm watching today's moneybomb. Keep the money coming!
I've also added a small feature: you can now choose if you want to see the time period and the units for which you wish to see statistics.
Wednesday, November 14, 2007
Outliers
I've tweaked the grapher to remove outliers -- numbers that are way inconsistent with the rest, such as the Nov 5th rates -- from the daily averages. I think this provides a much more useful view - the average line on the daily graph now represents "an average day" -- since November 5th was anything but average, and it could be misleading to compare the donation rates of a plain non-moneybomb day with the average of every day, moneybomb or not.
Let me know what you think.
Monday, October 29, 2007
Offline donations incorporated
On Oct. 25th the Ron Paul campaign manually added $430k of offline donations to the flash widget without adding it to the database totals. I have finally added this information to the statistics and projections table, but I have left the graphs untouched.
For a while I didn't want to incorporate this into any graphs, because suddenly adding that large an amount would create a huge rate spike and throw all the averages out of whack. Even if I could manually correct for that (which I can), there would still be a huge, unexplained spike in the total donations graph.
Dan from ronpaulgraphs.com had added the spike to his graphs, and ended up removing it in the end, as it caused too much confusion. Instead of trying the same thing, I've opted to make use of the offline information only in the projection table.
Previous updates
- 10/25/07 - Donor count is back!
- 10/20/07 - ronpaul2008.com stopped feeding number of donors. Half the graphs are now broken.
- 10/18/07 - Added exponential moving average predictions. That was an interesting one.
- 10/16/07 - Added daily averages.
- 10/15/07 - Daily graphs are now much, much neater.
- 10/13/07 - Added overlapping daily view
The blagging has begun
A static site -- even if it isn't static at all -- is nothing without a blog these days. This, therefore, is a necessity.
Subscribe to:
Posts (Atom)